By Jim Boyce | Another year, another set of wine stats from China Customs to consier. I’m on deadline tonight so here’s a quick look at the ten nations with more than 95 percent share of a market that grew 22 percent by volume and 17 percent by value in 2016. I’ll post more later.

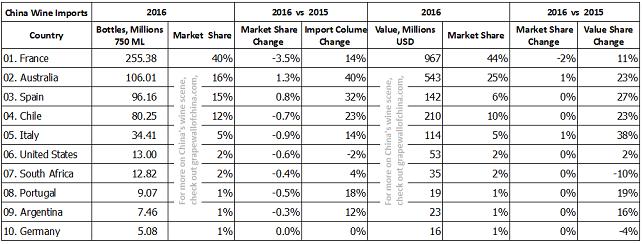
The chart above gives you the basics on market share per country. You can find a more detailed chart at the bottom of this post and can get more in-depths look at each country for 2015 here.
France. Its massive lead means that even another slip in market share still sees it far ahead of the pack. Add that the size of the market is growing, that French imports were up 14 percent, and that the country is on the verge of one billion USD in sales, and things still look pretty good for the leader.
Australia. Notable growth by volume (40 percent) and value (23 percent) solidifies its second-place spot and makes it the success story of the past few years. With a 16 percent volume share and whopping 25 percent value share, it has the priciest bottles of any country in the top ten. A free trade pact with China, a good reputation for safe products and imports linked to business visa for Chinese citizens are among the factors helping those numbers.
Spain. Almost the same story as Australia by volume, as it just trails that country by a few million bottles, but a much different one by value. With 15 percent market volume and only 6 percent market value, Spain continues to be a source of low-priced wine. On the other hand, if consumers know where to look, they can get some pretty nice deals.
Chile. It solidifies itself in the top four with growth of 23 percent both by volume and value, beating the industry averages. It’s close to Australia and Spain by volume and tucked between them in terms of value-per-bottle. Chile’s easy-to-drink wines and its free trade pact with China help maintain its position.
Italy. The good news: Italy’s volume grew 14 percent growth. The bad news: it still lagged the industry average and dropped even further behind France, Australia, Spain and Chile, a tough position given the cultural advantages it holds in China and the massive amounts of marketing money spent. But there is a bright spot: value rose 38 percent, meaning some pricier wines are being imported.
United States. After a tough 2015, last year was level, with a slight drop in volume and a slight increase in value. It’s been fairly tough going for the United States, with its wines tending to be pricier, suggesting more entry-level gateway products might be in order. Also, the appreciating US dollar did not help.
South Africa. After a tremendous burst in 2015, some thought there would be a correction in 2016 due to overstocked warehouses. Instead, South Africa remained steady and is in a position to overtake the U.S. for sixth spot.
Growth of nearly 20 percent in value and volume helped Portugal keep its place, although value per bottle remains low. Argentina saw growth but, like 2015, at lower levels than the industry average, disappointing given this country has the potential of Chile and South Africa. And Germany remained flat again although it kept its tenth place position.
Here’s a more detailed chart. And I’ll post more about these numbers soon.

(Thanks to TLW for the data.)
Follow Grape Wall on Facebook and Twitter. Sign up for the free China wine e-newsletter below. And check out these wine books as well as sibling sites World Baijiu Day and Beijing Boyce.
Grape Wall has no sponsors of advertisers: if you find the content and projects like World Marselan Day worthwhile, please help cover the costs via PayPal, WeChat or Alipay.
Sign up for the free Grape Wall newsletter here. Follow Grape Wall on LinkedIn, Instagram, Facebook and Twitter. And contact Grape Wall via grapewallofchina (at) gmail.com.

Leave a Reply
You must be logged in to post a comment.